
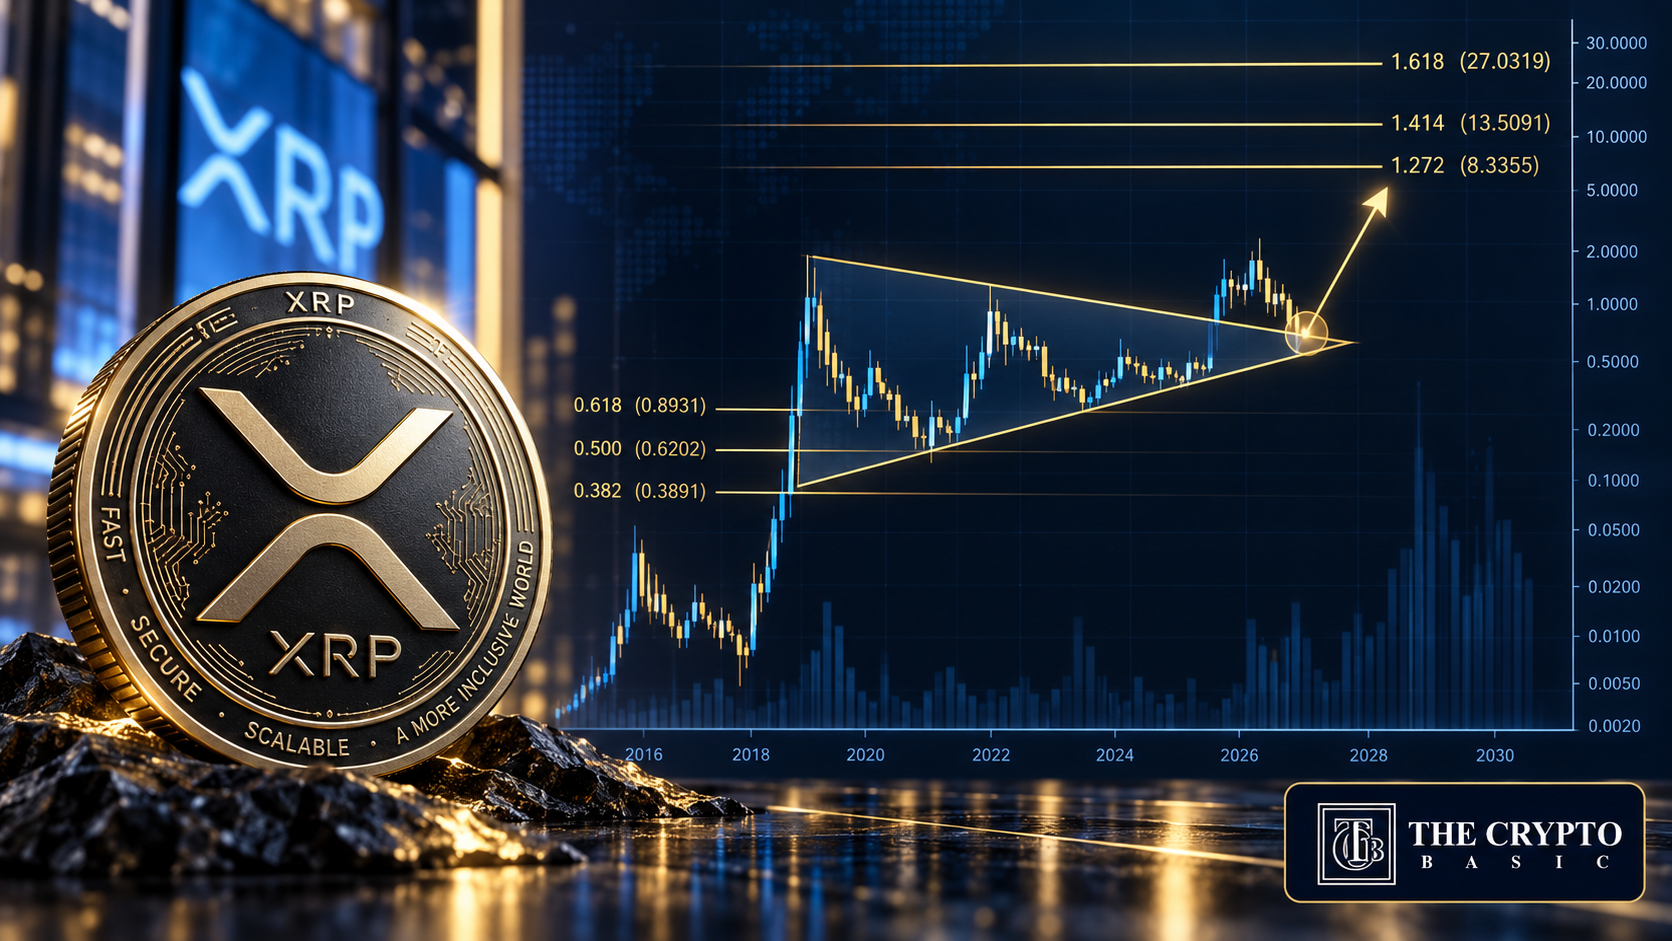
XRP’s long-term chart points to a major 2027 retest, with Fibonacci extensions at $8.33, $13.51, and $27.03 if the broader structure holds
XRP long-term chart is approaching a structural test that could shape its 2027–2029 outlook. This setup compares the current multi-year triangle with XRP’s 2014–2017 structure, where a retest near the apex came before a much larger advance
The above chart places XRP around $1.3838. It also shows price pulling back inside a smaller descending structure after the 2025 rally, while the much larger triangle that began after the 2018 peak continues to narrow toward 2027
The earlier 2014–2017 structure gives the current setup a useful historical reference. XRP entered that triangle after trading around the $0.03 area in 2014, then spent nearly three years compressing between lower highs and a gradually rising support line
By early 2017, price had been pushed toward the triangle’s apex, with XRP trading around $0.005–$0.006. The chart marks this area as the final retest before the structure broke to the upside
Once XRP escaped the triangle, the move accelerated quickly. The historical Fibonacci extensions shown on the chart stood at $0.13554 for the 1.272 level, $0.20895 at 1.414, and $0.38910 at 1.618
XRP eventually moved beyond all three as the 2017 expansion developed, later trading above $2 before the cycle peak arrived in early 2018
Technically, the important feature was not simply the size of the rally. XRP first spent years compressing, returned to the rising support area near the apex, and then broke decisively away from the structure
The current chart is drawing a similar comparison on a much larger timeframe. XRP is again moving toward the convergence of a falling resistance line and rising support, with the next major retest projected around the $0.75–$1.05 area into 2027
The earlier triangle does not mean the same price behavior must repeat, but it explains why holding that long-term support would be important before the higher Fibonacci extensions become relevant
The chart does not actually place the $8-$27 projections in 2027
Instead, 2027 is where the long-term triangle and retest appear to converge. The larger upside arrow begins from that area and extends into the years that follow
That makes 2027 more of a structural confirmation point, while the higher Fibonacci extensions sit farther out across the 2028–2030 portion of the chart
Three long-term extensions are marked above the pattern
From the chart’s $1.3838 reference price, those levels represent gains of roughly 502%, 876%, and 1,853%, respectively
These are not direct forecasts for a specific year. They only come into play if XRP first completes the retest, holds the broader structure, and then breaks back into expansion
The next observable test is therefore not $27. It is whether XRP can hold the multi-year support structure into 2027 and then reclaim the shorter-term resistance formed during the current correction


