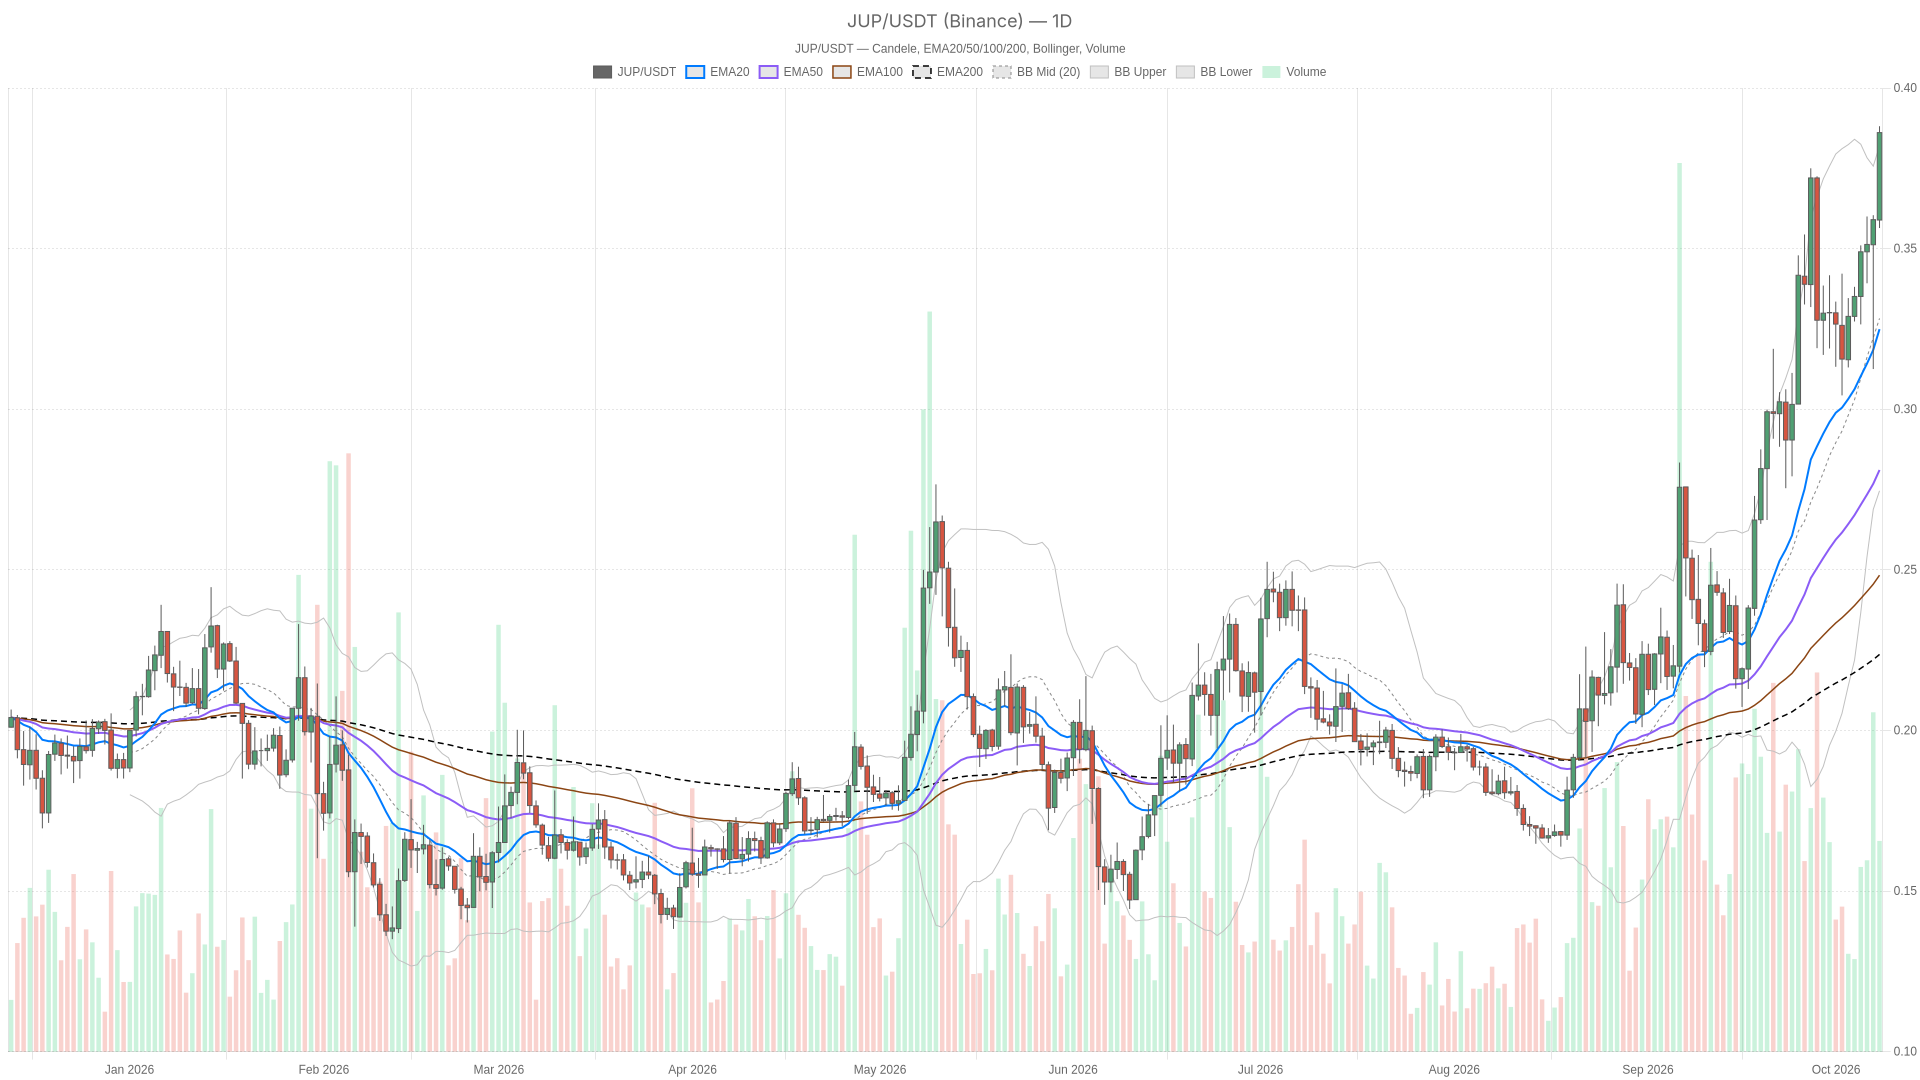
As of October 8, 2026, the Jupiter price is $0.3861 on Binance’s live JUPUSDT daily candle, with a bullish daily structure but an increasingly stretched short-term setup. The dominant technical force remains upward, although hourly momentum readings make an uninterrupted advance less convincing
The daily trend points upward but short-term momentum is conflicted. The last completed daily candle closed at $0.3590, below daily R1 at $0.3754. The live daily price now sits above that level, but a completed daily breakout has not been confirmed. An intraday move through a daily reference is not the same as acceptance above it at the daily close
The last completed hourly candle closed at $0.3792, whereas the live hourly price is $0.3862. Hourly structure confirms the bullish daily bias, but its momentum evidence is less consistent. On the execution timeframe, the live 15-minute price is $0.3863 against a last completed close of $0.3869. That small price retreat does not, by itself, establish a momentum reversal
Moving averages across all timeframes remain bullishly stacked, confirming structural trend strength rather than merely positive momentum. The daily EMA20, EMA50 and EMA200 stand at $0.3185, $0.2768 and $0.2220. Price is above each, and their bullish ordering gives the daily trend a clear structural foundation
The same alignment holds below the daily chart. Price is above the hourly EMA20 at $0.3533, EMA50 at $0.3446 and EMA200 at $0.3372, and above the 15-minute EMA20 at $0.3745, EMA50 at $0.3619 and EMA200 at $0.3451. Both sets are bullishly stacked. A short-term retracement could therefore occur while the broader moving-average structure remains intact
Bollinger Bands show the extension more clearly. Price is above the daily upper band at $0.3757 and the 15-minute upper band at $0.3835, but below the hourly upper band at $0.3918. The daily midpoint is $0.3222 and the lower band is $0.2688. The market is stretched relative to the daily and execution-timeframe envelopes, while the hourly envelope still leaves an overhead reference to test
ATR measures $0.02741 on the daily chart, $0.007802 hourly and $0.005546 on the 15-minute chart. These readings describe the scale of movement, not its direction; the nearby support and resistance references need to be read within that volatility context
The RSI picture is bullish across timeframes, but the hourly MACD is narrowing while RSI rises, creating a divergence that tempers short-term conviction. Daily RSI is rising at 66.9, supporting the bullish bias without reaching overbought territory. Hourly RSI is rising at an overbought 80.6, while 15-minute RSI is also rising and overbought at 71.5. Strength is concentrated in the shorter horizons, where the risk of mean reversion is more immediate
MACD complicates that picture. The daily histogram has crossed from negative to slightly positive across the last three completed readings, reinforcing the broader bullish case. The hourly histogram remains positive but is falling and narrowing, so upward momentum is losing intensity even as hourly RSI rises. The 15-minute histogram has crossed into slightly positive territory. That execution-level improvement does not erase the hourly divergence between strong RSI and fading MACD
The hourly Bollinger upper band at $0.3918 is the line that divides bullish continuation from a failed breakout. An hourly close above it would confirm, while a close below hourly R1 at $0.3819 would flip the near-term bias bearish
Bullish scenario: an hourly close above the hourly Bollinger upper at $0.3918 would confirm continuation beyond the nearest supplied overhead level. This trigger remains pending: the last completed hourly close was $0.3792. An hourly close below hourly R1 at $0.3819 would invalidate this continuation setup. No higher resistance is supplied, so there is no supported upside target beyond the trigger
Bearish scenario: an hourly close below hourly R1 at $0.3819 would confirm a short-term rejection, bringing the hourly pivot at $0.3769 into focus. Below that sit the daily Bollinger upper at $0.3757, daily R1 at $0.3754 and hourly S1 at $0.3742. An hourly close back above hourly R1 at $0.3819 would invalidate this bearish setup. This would initially be a retracement scenario, not proof that the daily trend has reversed
The daily pivot at $0.3440 and daily S1 at $0.3275 mark deeper structural references rather than immediate breakdown triggers. The likeliest false signal, in this reading, is a brief push above the hourly upper band that fails to hold into the hourly close. Overbought short-term RSI and narrowing hourly MACD make that risk relevant; conversely, a temporary dip below hourly R1 without a confirming close would not establish the bearish scenario
Sentiment reads Greed at 64, but the broader market is not uniformly strong. Total crypto market capitalization fell 3.32% over the past 24 hours, making Jupiter’s strength a local signal rather than evidence of broad-based bullish conditions. Alternative.me’s Fear & Greed Index stands at 64, classified as Greed. CoinGecko reports total crypto market capitalization of $2,834,289,231,355.01, with a 24-hour change of -3.32%, and Bitcoin dominance at 58.77%. The contrast between constructive sentiment and negative market-cap change underscores that Jupiter’s bullish technical structure is a localized development
No. The quoted $0.3861 is the live daily-candle price. The last completed daily candle closed at $0.3590
No. The overbought readings are on the hourly and 15-minute charts. The daily bias remains bullish, while the shorter horizons carry the tension between strong RSI and weakening hourly MACD momentum
An hourly close above the hourly Bollinger upper band at $0.3918 would confirm continuation beyond the nearest supplied overhead level. Until such a close occurs, the bullish scenario remains pending
Disclaimer: This article is for informational purposes only and does not constitute financial advice, an investment recommendation, or a solicitation to buy or sell any financial instrument or cryptocurrency. The analysis provided is not indicative of future results. Investing in crypto assets and financial markets carries a high risk of capital loss. Always do your own research (DYOR) and consult a qualified financial advisor before making any decision
Article produced with the assistance of artificial intelligence and reviewed by the editorial team
Stay updated on all the news about cryptocurrencies and the entire world of blockchain