Discover more from The Central Banks' Watcher
Central Banks' Watcher offers an analysis and insights on major central banks policy decisions and macroeconomic challenges.
By subscribing, you agree to Substack's Terms of Use, and acknowledge its Information Collection Notice and Privacy Policy.
# Central Bank Commentary (September-26): Federal Reserve, Bank of England, Bank of Japan, and the Swiss National Bank
##### _New this edition: at the end of each central bank section, you will find a short poll asking what you expect that bank to do at its next meeting. Voting is anonymous. Substack shows me only the overall results, the same tally every reader sees, and never who voted or how. I will report the results alongside the actual decisions in the next edition, so we can see how this readership’s collective call compares with the market’s and with the central banks themselves. It takes a few seconds, and the more of you who vote, the more useful the comparison becomes._
September signalled a shift towards a possible global tightening cycle. The Federal Reserve raised rates for the first time since July 2023, and the Bank of Japan took its policy rate to the highest level since 1995, while the Bank of England held, with three members voting for an immediate increase, and the Swiss National Bank stayed at zero. The ECB raised its policy rates by 25bps, its second increase this year after June. Markets, however, had moved well ahead of them. In the _**December edition**_, I looked at how yield curves were steepening as the easing cycle advanced; this edition starts from the opposite question: how far rates have risen since January, and where along the curve the rise has been concentrated (see also _**Is it Debt or Central Banks?**_).
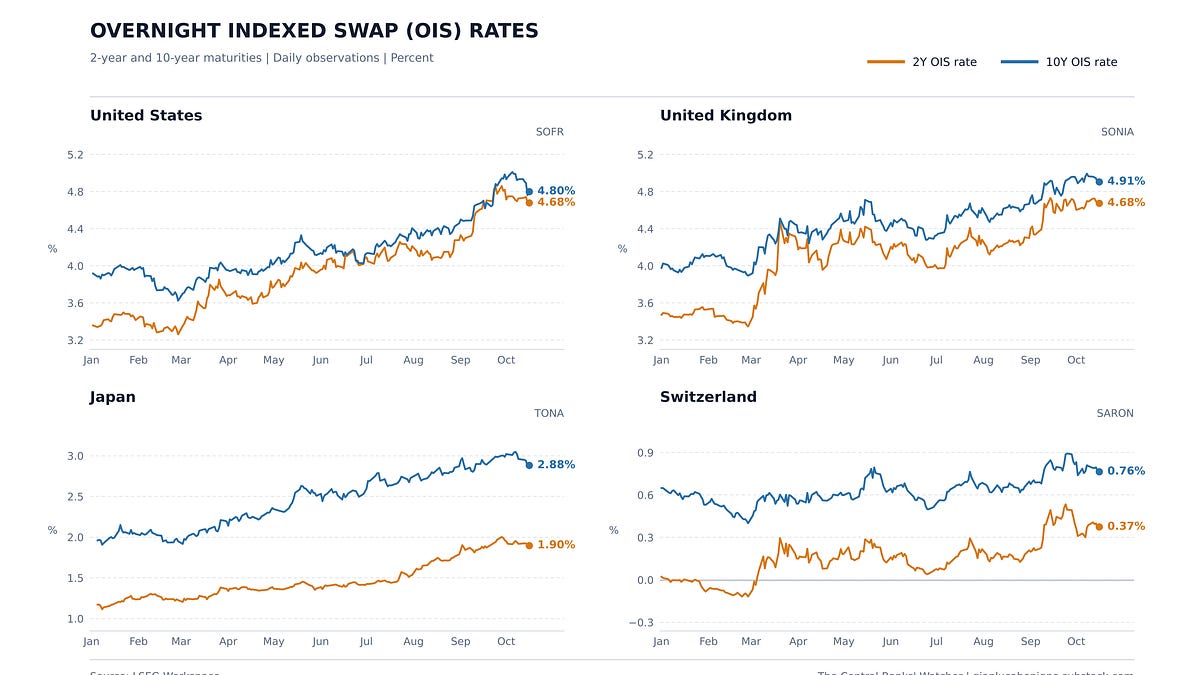
The chart plots daily 2-year and 10-year overnight indexed swap (OIS) rates since the start of the year, referenced to each economy’s overnight rate (SOFR, SONIA, TONA and SARON). Because OIS contracts carry almost no credit risk, the 2-year rate is close to a direct read of the expected policy path over the next two years, while the 10-year adds the term premium investors require for holding duration. Comparing the two provides a simple way to separate the part of the increase that reflects expected policy from the part priced at the long end, without relying on term-premium models, which, as rightly noted in a very interesting _**FT article**_ by Chris Giles , can disagree on whether the US term premium has risen at all this year.
In the United States and the United Kingdom, the front end has done most of the work. Since January, the US 2-year rate has risen by about 130bps, to 4.68%, against roughly 90bps for the 10-year, now at 4.80%; in the UK the 2-year is up about 120bps, to 4.68%, and the 10-year about 95bps, to 4.91%. The US curve has flattened from 56bps to 12bps and the UK curve from 51bps to 23bps, the signature of a market moving from pricing cuts to pricing hikes. The timing differs: the US 2-year bottomed on 27 February, the eve of the war, and then climbed steadily, with a final shift higher around the Fed’s September increase, while sterling 2-year rates jumped by about 90bps between the end of February and the end of March.1
Japan is the mirror image. The 2-year rate has risen about 75bps, to 1.90%, broadly in step with the Bank of Japan’s gradual increases, but the 10-year has gained about 90bps, to 2.88%, and the curve has steepened from about 80bps to around 100bps. Because these are swap rates, the rise at the long end carries no sovereign credit premium: it reflects the global rise in term premia and a higher expected policy path beyond two years. Switzerland moved the least. The 2-year rose from around zero to 0.37%, most of it in March, while the 10-year is only about 10bps higher, at 0.76%; the run-up in the 2-year to above 0.5% in late September, and its retreat since, look like a market that priced an SNB move and then took it out.
Set against policy itself, the gap is striking. Since January, policy rates have risen by 25bps in the United States and 50bps in Japan and have not moved in the UK or Switzerland, while 2-year OIS rates have risen by roughly 130, 75, 120 and 35bps respectively. Where the front end has moved, the curve is already delivering part of the tightening that central banks are still debating, which is precisely the argument the Bank of England’s majority now makes for waiting. Where the long end has moved, as in Japan, conditions are tightening through term premia and the expected path beyond two years, which the central bank influences only indirectly. On the two points that matter most here, Chris Giles and I agree: longer-term inflation expectations remain anchored, and markets are pricing central banks’ hawkishness rather than doubting their credibility. I put less emphasis on the other hand on fiscal risk: he reads the larger rise in 10-year government yields in France, Italy, the United States and Japan as compensation for it, but government yields mix that premium with the expected policy path. Measured against swap rates, US and Japanese yields have risen no faster than swaps since the war began; France, whose spread over Germany has widened sharply, is the clear exception.
##### Why are bond yields so highChris Giles FT, 6th October
##### The Return of Nonlinear Inflation: Part II