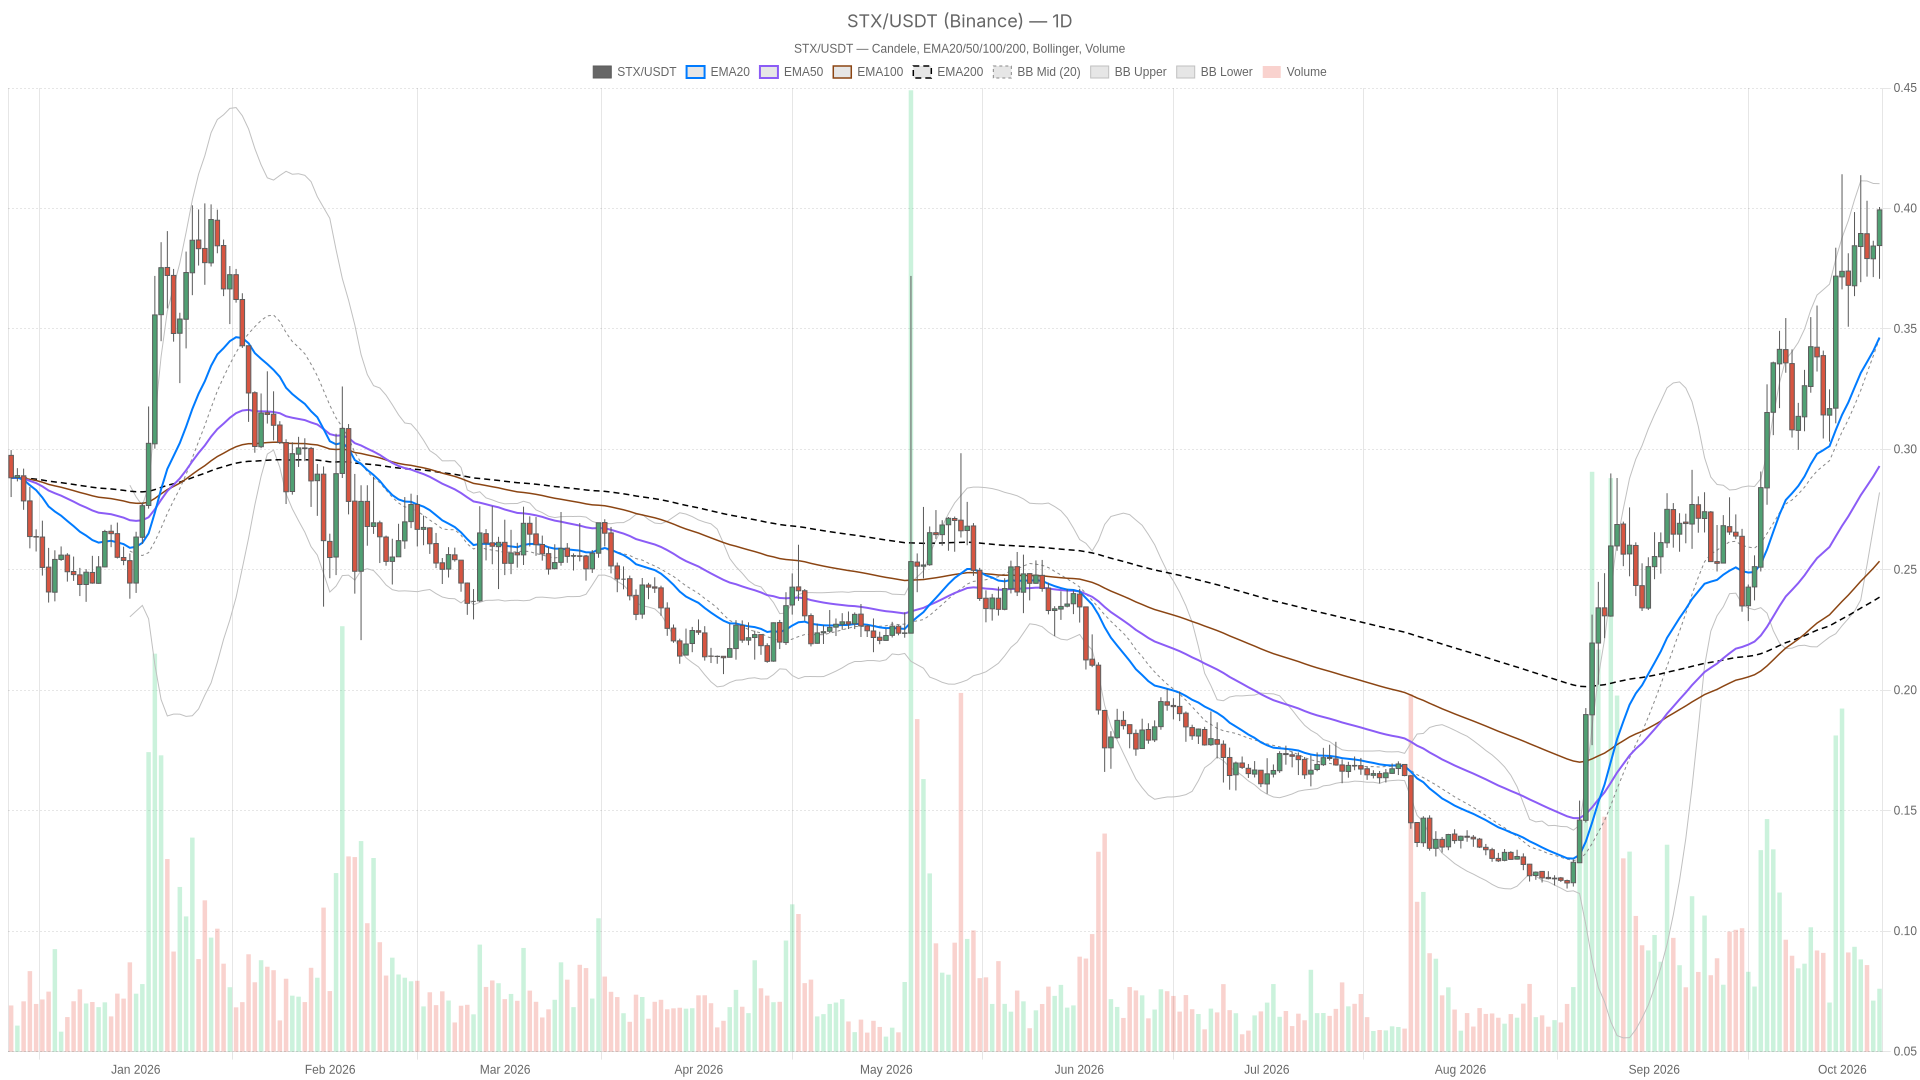
As of October 7, 2026, the Stacks price is trading at $0.3994 on Binance, sitting just above the daily R1 pivot at $0.39017 after the last completed daily candle closed at $0.3844
The move matters. STX isn’t just holding a bullish trend. It’s pushing into stretched, overbought readings on shorter timeframes that usually force a decision. Either the breakout extends with fresh buyers stepping in on the daily chart, or the 15-minute and hourly exhaustion catches up and triggers a pullback into the broader uptrend
The dominant force right now is a trend that remains structurally bullish on every timeframe we’re tracking, but the fuel behind it is uneven. The daily chart shows momentum cooling even as price grinds higher, while the hourly and 15-minute charts show momentum accelerating. That’s a classic late-stage-trend tension. The big picture hasn’t broken, but the engine room is starting to overheat on short-term measures. Meanwhile, the daily MACD histogram loses some of its earlier thrust
STX has already cleared the daily R1 level at $0.39017, which means that pivot now sits behind price rather than in front of it. The next resistance on the daily chart is the Bollinger upper band at $0.41037. On the hourly chart, price at $0.3994 remains just below the hourly R1 at $0.3999, making that the more immediate line in the sand. Notably, the daily pivot at $0.38083 coincides with the hourly EMA50, which makes that zone a more meaningful support cluster than either level would be on its own
Bullish scenario: an hourly close above $0.3999, the hourly R1, would clear the last intraday ceiling and open a path toward the daily Bollinger upper band at $0.41037. That setup would fail if price slips back below the hourly pivot at $0.3944, suggesting the breakout attempt ran out of steam
Bearish scenario: a daily close back under $0.39017 would flag a rejection of the daily R1 that STX has already pushed through intraday. This would point toward the daily pivot at $0.38083, the same zone where the hourly EMA50 sits. That bearish case loses its force if hourly closes reclaim $0.3999, putting the bulls back in control
The daily RSI sits at 67.79, approaching overbought but not there yet, and its last three closed readings (70.8, 66.8, 67.8) are mixed rather than trending in one direction. The hourly RSI tells a cleaner story: at 65.01 it has been rising over its last three closed readings (46.6, 59.6, 65), showing buyers building conviction. The 15-minute RSI at 73.53 is already in overbought territory and its recent readings (71.1, 73.5, 73.5) are flagged as rising, meaning the shortest timeframe is the most stretched of the three
MACD adds another layer to the tension. The daily histogram is positive at 0.00243 but its last three closed readings are falling and narrowing, meaning the bigger trend is still up but losing momentum. The hourly histogram tells the opposite story: positive at 0.00147 and widening over its last three readings, a sign of momentum gaining into the move. The 15-minute histogram is also positive and widening. So while the daily chart is cooling off, the hourly and 15-minute charts are both accelerating — a disagreement worth taking seriously
On the daily chart, the Bollinger mid-band sits at $0.3388 with the upper band at $0.41037 and the lower band at $0.26723. Price trading well above the mid-line and closing in on the upper boundary signals an extended but still-intact uptrend. On the hourly chart, price at $0.3994 has pushed above its own upper Bollinger band at $0.39192, which typically signals a short-term overextension. The 15-minute upper band at $0.40225 hasn’t been touched yet, leaving room before that timeframe flags the same kind of stretch
The EMA structure backs the bullish case unambiguously. On the daily, hourly, and 15-minute charts alike, price sits above all the EMAs. The EMA order is bullish on every timeframe — EMA20 above EMA50 above EMA200, the textbook stacked arrangement. Daily ATR stands at roughly $0.0306, hourly ATR at about $0.0067, and 15-minute ATR near $0.0044, all pointing to a market where ranges have been expanding alongside the price move
Separately, the data shows total DEX trading volume across the Stacks chain at roughly $3.27 million over the past 24 hours, but the breakdown by venue is anything but uniform. Bitflow’s volume dropped 68.64% over 24 hours and 57.69% over seven days, yet it’s still up 165.71% over the past 30 days. ALEX saw a smaller 24-hour decline of 18.6% but gained 114.42% over seven days. Velar AMM jumped 80.28% in the last 24 hours and is up 1,383.02% over 30 days. Because this is chain-wide activity and not STX-specific flow, the mixed picture across venues shouldn’t be read as a single directional signal for the token
Meanwhile, the Fear & Greed Index from Alternative.me reads 71, classified as Greed, consistent with a market still rewarding risk-taking even as some indicators flash caution. CoinGecko’s total crypto market cap stands at roughly $2.88 trillion, down 4.39% over the past 24 hours, while Bitcoin dominance sits at 58.8%. That combination — greedy sentiment against a market cap that pulled back over the past day — is a reminder that broad risk appetite and short-term price action aren’t always in sync. STX’s setup should be read against that backdrop
STX is trading at $0.3994 on Binance, above the daily R1 pivot at $0.39017, after the last completed daily candle closed at $0.3844
The 15-minute RSI at 73.53 is in overbought territory, the hourly RSI at 65.01 is rising but not yet overbought, and the daily RSI at 67.79 is approaching overbought without crossing it
An hourly close above the hourly R1 at $0.3999 would open room toward the daily Bollinger upper band at $0.41037, provided price doesn’t fall back below the hourly pivot at $0.3944
Disclaimer: This article is for informational purposes only and does not constitute financial advice, an investment recommendation, or a solicitation to buy or sell any financial instrument or cryptocurrency. The analysis provided is not indicative of future results. Investing in crypto assets and financial markets carries a high risk of capital loss. Always do your own research (DYOR) and consult a qualified financial advisor before making any decision
Article produced with the assistance of artificial intelligence and reviewed by the editorial team
Stay updated on all the news about cryptocurrencies and the entire world of blockchain