As of October 1, 2026, Bitcoin trades at $84,823, supported by a bullish EMA stack that keeps the macro trend intact. Yet the daily MACD histogram has turned negative, signaling cooling momentum even as the bitcoin value structure remains firmly bullish
The dominant force right now is a bullish trend structure that remains intact across all major moving averages, yet clear signs of momentum deceleration are emerging on the daily MACD. The direction is still up, but the conviction behind the move is weakening
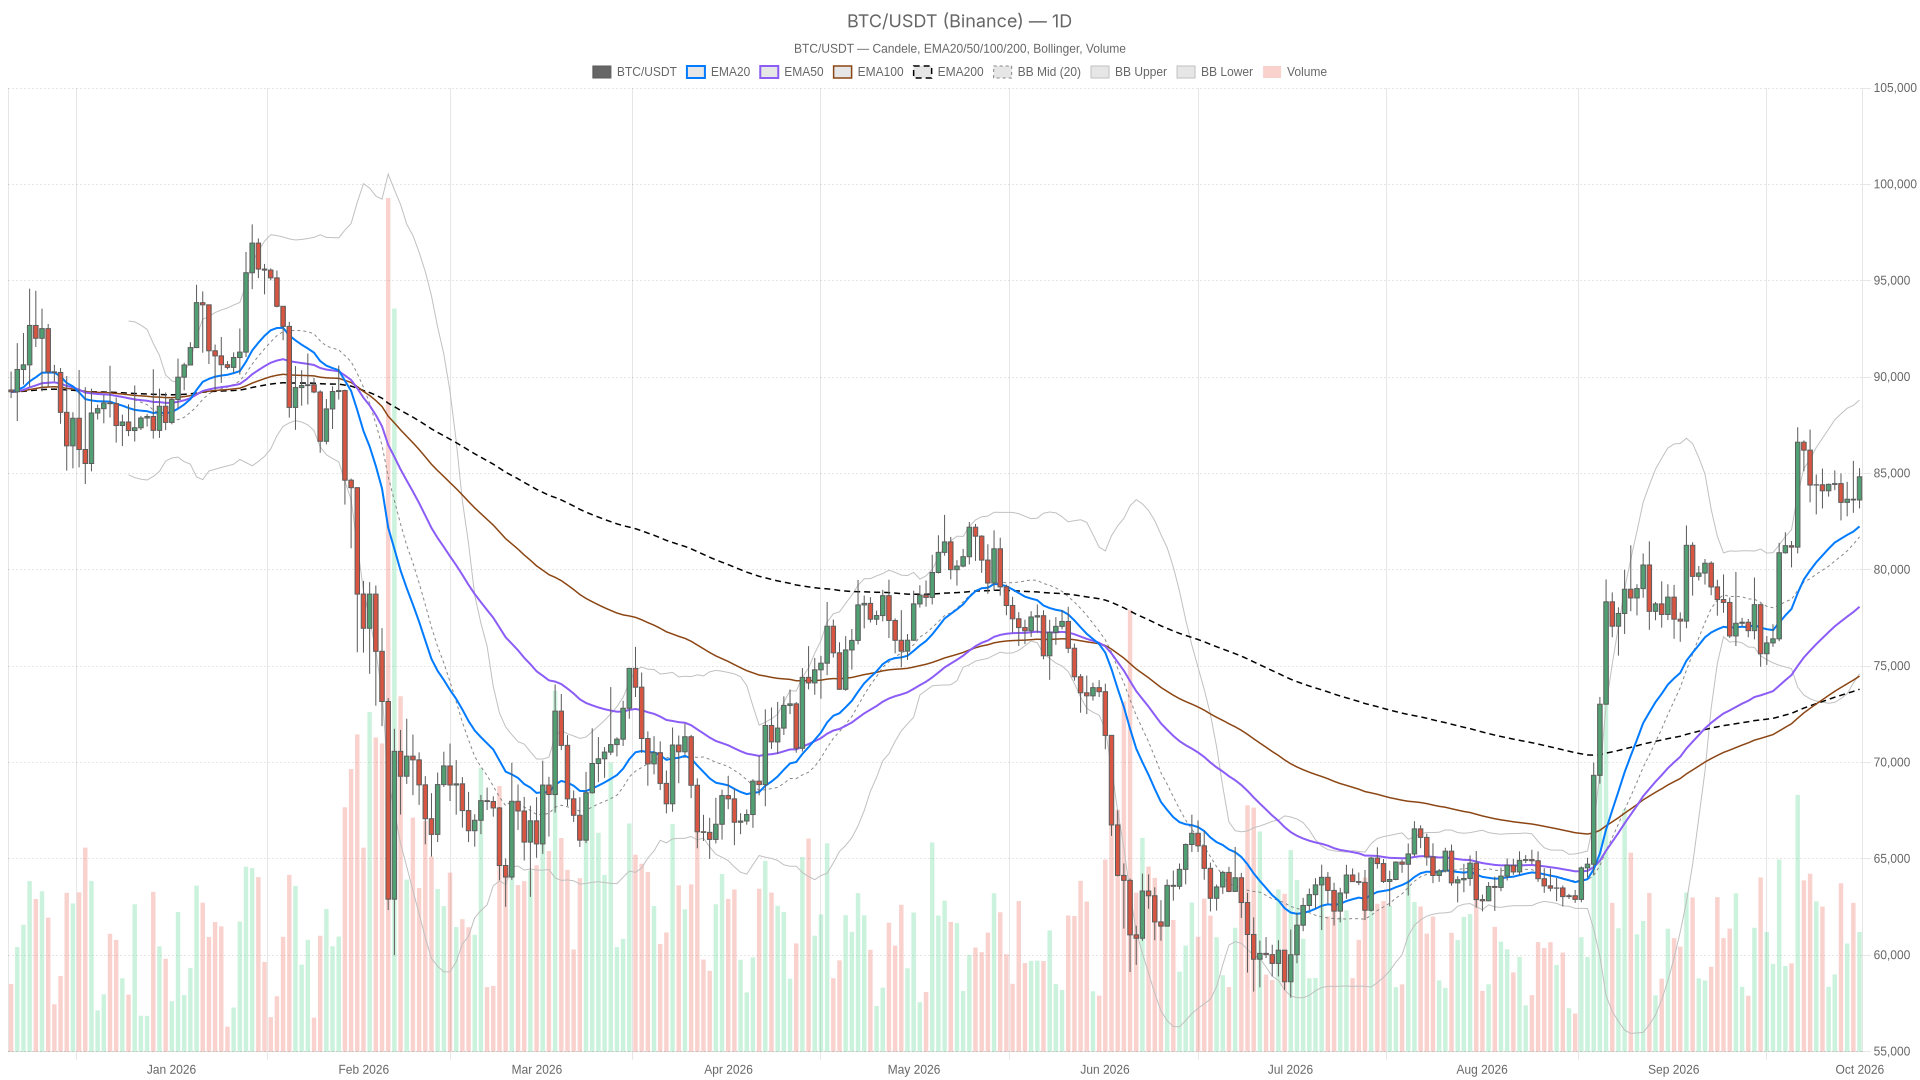
Specifically, on the daily timeframe — the one that defines the macro bias — the regime is tagged bullish, and for good reason. Price has been riding above all three major EMAs for a sustained stretch. The EMA20/50/200 alignment ($82,253 / $78,082 / $73,801) shows no sign of a structural breakdown. RSI14 at 64.66 backs that up: it is elevated enough to confirm real buying pressure, but nowhere near the 70+ zone where exhaustion typically becomes a concern
However, the wrinkle is the MACD. The line (2,054.74) has slipped under the signal (2,168.71), and the histogram has gone negative. In plain terms, the trend is still up, but the engine pushing it there is decelerating. This is the classic late-stage-rally signature — not a reversal signal on its own, but a warning that the next leg higher needs fresh buying, not just inertia, to materialize
Meanwhile, the daily Bollinger Bands add useful context. With the mid-band at $81,707 and the upper band at $88,806, current price sits in the upper-middle portion of its range. It is elevated, but not pinned against the top. That leaves technical room to extend toward $88,800 without triggering an overextension signal. ATR14 at $2,454 offers a sense of what a normal daily swing looks like, more useful for sizing stops than reading direction
Additionally, pivot levels frame the next decision point cleanly: price is just above the daily pivot at $84,427, with resistance at R1 ($85,669) and support at S1 ($83,581). Clearing R1 would reassert bullish control; losing the pivot would open the door to a short-term pullback toward support
The hourly chart broadly confirms the daily bullish bias, but the 15-minute chart shows intraday thrust softening — placing the market at a decision point rather than mid-trend. This multi-timeframe disagreement is the real story right now
On the hourly, EMA20 ($84,143), EMA50 ($83,929) and EMA200 ($83,808) are all stacked below the current close of $84,814. RSI14 at 63.94 mirrors the daily reading almost exactly. However, here is the catch: the hourly MACD histogram is positive (+110.72), the opposite sign of the daily histogram. That means while daily momentum is cooling, intraday buyers are still actively pushing — suggesting consolidation or distribution near highs rather than an outright reversal
Moreover, price on the hourly chart is sitting right against the upper Bollinger Band ($84,868) and glued to the hourly pivot ($84,813), with R1 barely above at $84,892. That is a tight coil. The 15-minute chart adds execution context: EMAs are aligned bullish (84,524 / 84,206 / 83,898), but the MACD histogram has shrunk to +29.32 from the hourly’s +110.72. For short-term entries, chasing a long directly into this resistance pocket is lower-quality. Waiting for a clean break or a retest of the hourly EMA cluster near $83,900 offers a better setup
The bullish case hinges on Bitcoin clearing daily R1 at $85,669 while hourly momentum re-expands rather than fades, which would open a path toward the upper Bollinger Band near $88,806. There is also a fundamental tailwind supporting this outlook
In this scenario, if bitcoin value clears daily R1 at $85,669 while hourly momentum re-expands, the path toward the upper Bollinger Band near $88,806 opens up. The key condition is the histogram expanding rather than fading. Citigroup raised its one-year Bitcoin forecast to $113,000 on October 1 (Fortune). This gives bulls a longer-term narrative to point to even if short-term momentum is choppy. The scenario would be invalidated if price repeatedly rejects R1 while the daily MACD histogram stays negative — that would mark a stall rather than a breakout
Conversely, a rejection at current levels would open a retracement toward daily S1 at $83,581 and potentially deeper toward the daily EMA50 at $78,082, a scenario supported by macro headwinds that have not fully faded
Specifically, if price slips back under the daily pivot ($84,427) and through the hourly EMA50/EMA200 cluster ($83,808–$83,930), the door opens toward daily S1 ($83,581) and potentially deeper. Bloomberg reported on September 24 that rising bond yields and a stronger dollar were weighing on crypto. The 24-hour market cap decline of -2.09% shows that kind of macro pressure has not fully gone away. This scenario would be invalidated as long as price holds above the daily EMA20 (~$82,253)
Ultimately, the daily trend remains bullish by every structural measure, but the momentum readout is asking whether buyers will show up again at resistance. The next few sessions are a test of conviction rather than a foregone conclusion
That said, a Fear & Greed score of 74 suggests sentiment is running ahead of the broader market cap action. Historically this is not a reason to panic, but it is a reason to size positions with the current ATR-implied volatility in mind. Whichever direction price moves from here, the outcome is likely to be decided at the pivot and resistance levels already in play — not in a vacuum
Yes. As of October 1, 2026, Bitcoin trades at $84,823, firmly above its daily EMA20 ($82,253), EMA50 ($78,082), and EMA200 ($73,801). All three moving averages remain in bullish alignment, and RSI14 at 64.66 confirms genuine buying pressure without approaching overbought territory
The daily MACD histogram has turned negative (-113.97) because the MACD line has slipped below the signal line. This indicates that momentum is decelerating even though price structure remains firmly bullish. It is a common late-stage-rally signature and not a standalone reversal signal
The immediate resistance is daily R1 at $85,669. Above that, the daily upper Bollinger Band at $88,806 represents the next major target. Citigroup’s updated Bitcoin forecast of $113,000 provides a longer-term bullish reference point
Disclaimer: This article is for informational purposes only and does not constitute financial advice, an investment recommendation, or a solicitation to buy or sell any financial instrument or cryptocurrency. The analysis provided is not indicative of future results. Investing in crypto assets and financial markets carries a high risk of capital loss. Always do your own research (DYOR) and consult a qualified financial advisor before making any decision
Article produced with the assistance of artificial intelligence and reviewed by the editorial team
Stay updated on all the news about cryptocurrencies and the entire world of blockchain