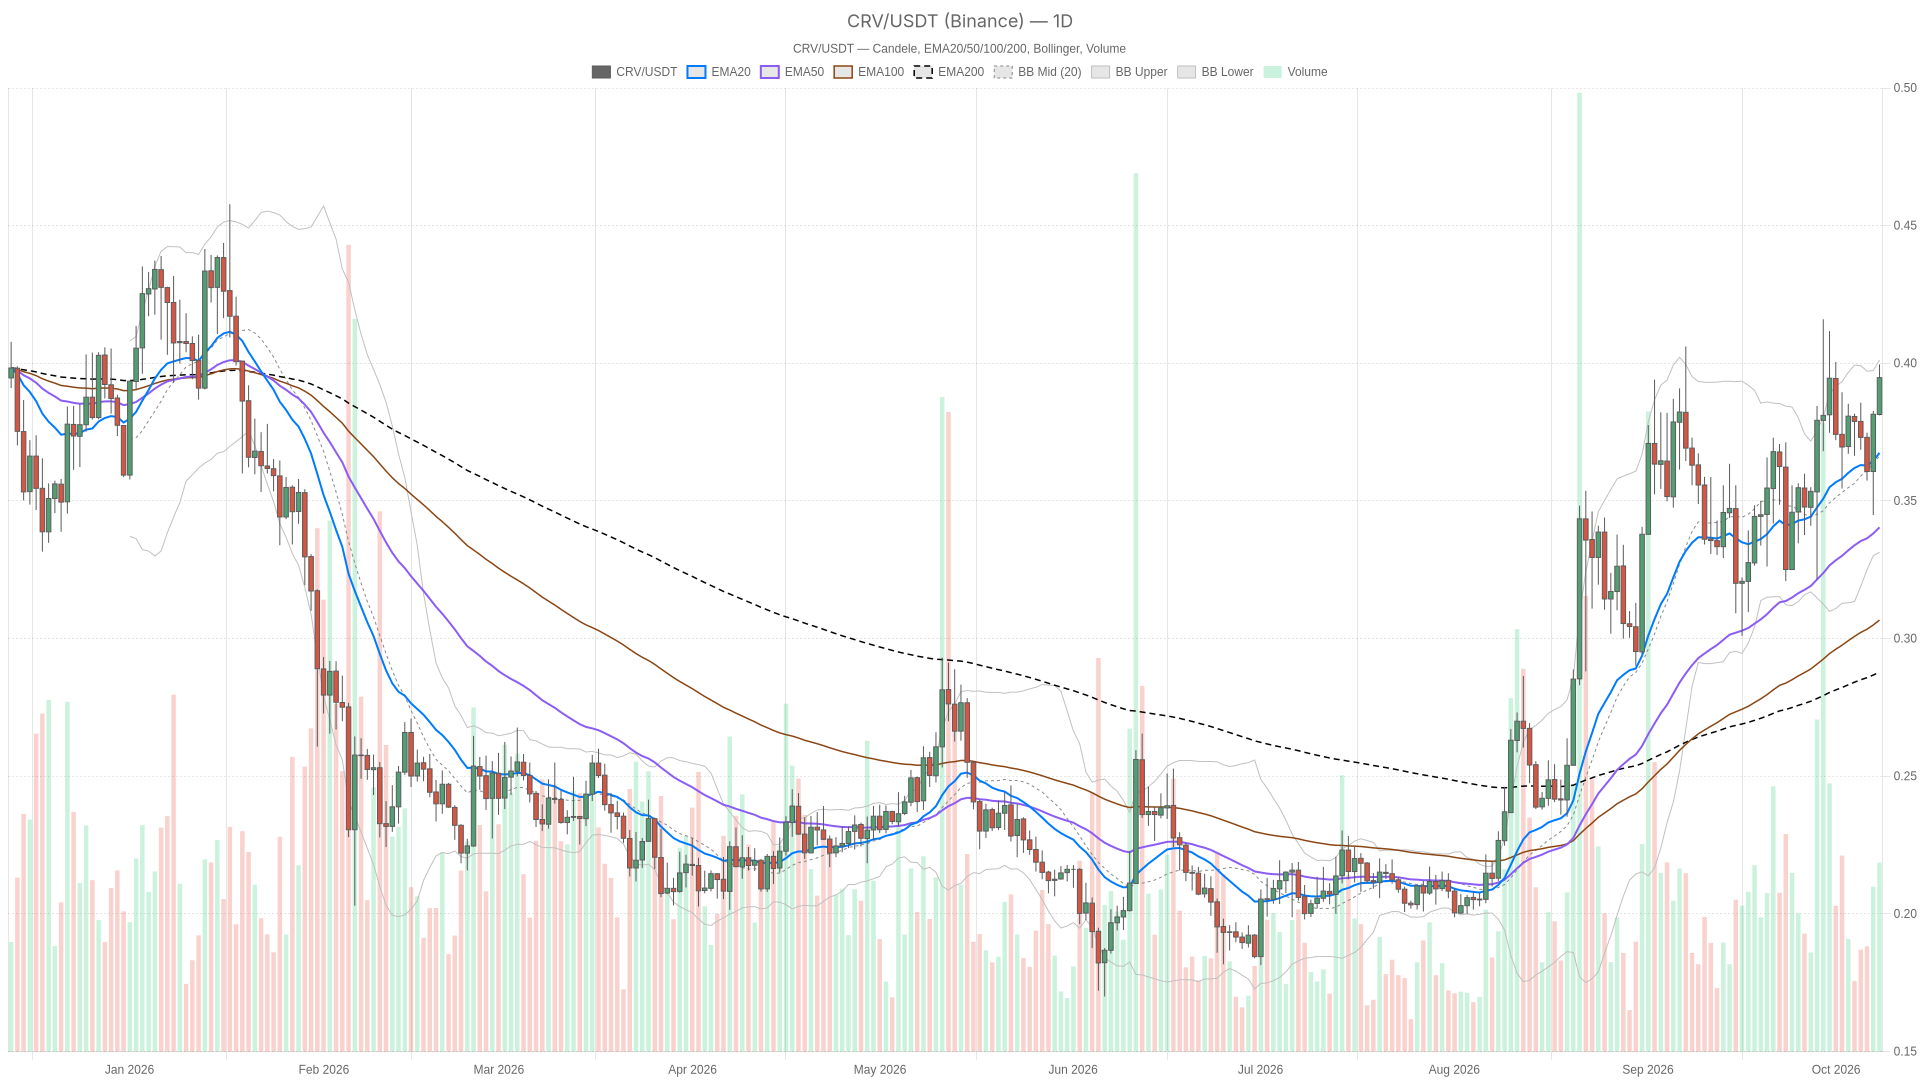
As of October 8, 2026, CRV trades at $0.3948, with the Curve DAO price retaining a bullish daily bias despite a less convincing short-term breakout setup. The upward trend structure dominates; the question is whether momentum carries price beyond nearby resistance rather than leaving it vulnerable to mean reversion
The distinction matters: price is already above daily R1, but that move is not yet confirmed by a completed daily candle. This is a bullish setup with a confirmation problem, not a clean breakout. Prices and technical readings below are based on Binance candle data; the current price belongs to an open candle. The last completed daily candle closed at $0.3815
The daily regime is bullish, while the hourly regime is neutral and the 15-minute regime is bullish. That split makes the shorter-term strength useful for execution context, but insufficient to establish that the daily advance has cleared its next hurdle
The last completed hourly and 15-minute candles closed at $0.3920 and $0.3936, respectively. The open candles therefore show price above those completed closes, but treating that as settled confirmation would overstate the evidence
CRV sits above all three daily EMAs in textbook bullish alignment, yet the daily Bollinger upper band at $0.3974 creates an immediate overhead test. On the daily chart, CRV is above the EMA20 at $0.3646, EMA50 at $0.3382 and EMA200 at $0.2868. Those averages support continuation as the main scenario rather than an outright trend reversal
The hourly price is also above its EMA20 at $0.3747, EMA50 at $0.3681 and EMA200 at $0.3693, but those averages are not aligned. This is the structural weakness in the setup: price is strong relative to its averages, yet the hourly trend has not achieved the same orderly configuration as the daily chart. On the 15-minute chart, price is above the EMA20 at $0.3883, EMA50 at $0.3805 and EMA200 at $0.3684, with bullish ordering. That supports the local advance without resolving the hourly mismatch
The daily Bollinger upper band at $0.3974 sits close above price, while its midpoint is $0.3638 and its lower band is $0.3302. CRV is testing the upper edge of the daily envelope, not trading near its mean. The hourly upper band at $0.4045 leaves more room overhead, whereas the 15-minute upper band at $0.3967 places an immediate execution hurdle nearby. In practice, a brief push through a short-term band would not, by itself, establish acceptance above the daily envelope
ATR is $0.02840 on the daily chart, $0.008150 hourly and $0.004930 over 15 minutes. These volatility measures are larger than the narrow distance to nearby resistance. The reading favors caution about the significance of small price excursions: the market can cross a level within ordinary candle movement without establishing a durable break
Daily RSI at 57.4 confirms rising momentum without overbought conditions, yet the daily MACD histogram remains negative, leaving the bullish structure without clean confirmation. Hourly RSI is 66.6, closer to the overbought threshold but with mixed recent direction. The 15-minute reading is 60.0 and rising. Together, these readings support upside participation, though the hourly evidence does not show consistent acceleration
MACD is less cooperative. The daily histogram is negative, and its recent direction is mixed after crossing zero; that leaves the broader bullish structure without clean momentum confirmation. The hourly histogram is positive but narrowing and losing momentum. Meanwhile, the 15-minute histogram remains negative but is narrowing toward zero. The short-term drag is easing, yet that is not the same as positive momentum confirmation. The conflict is explicit: daily RSI supports the advance, while daily MACD still questions its strength
Two clear scenarios hinge on nearby pivot levels: a continuation above hourly R1 or a retracement below the hourly pivot. CRV is above daily R1 at $0.3945, making that level immediate support rather than overhead resistance. The next hourly resistance is hourly R1 at $0.3957. Below price, the hourly pivot at $0.3893 is the nearest hourly support, followed by hourly S1 at $0.3855. The daily pivot at $0.3697 is a deeper structural reference: a retreat there would move the discussion away from a shallow resistance test and toward a broader retracement
An hourly close above hourly R1 at $0.3957 would trigger the continuation scenario. The last completed hourly close has not satisfied that condition. The next tests would be the daily Bollinger upper at $0.3974 and, beyond it, the hourly Bollinger upper at $0.4045. An hourly close below the hourly pivot at $0.3893 would invalidate this near-term bullish scenario
An hourly close below the hourly pivot at $0.3893 would trigger the bearish retracement scenario, bringing hourly S1 at $0.3855 into focus. Continued weakness would expose the daily pivot at $0.3697. An hourly close above hourly R1 at $0.3957 would invalidate that bearish reading. This would initially be a pullback scenario within a bullish daily structure, not evidence that the macro bias has already reversed
The likeliest false signal in this reading is a brief move above hourly R1 that fails to hold through the hourly close. Narrow spacing between resistance levels, meaningful candle volatility and fading hourly MACD momentum make an intrabar breakout less persuasive than completed-candle acceptance. Conversely, a temporary dip below daily R1 would be an early warning, not the bearish trigger defined here
Sentiment gauges show risk appetite, but they do not resolve CRV’s conflicting momentum signals. Alternative.me’s Fear & Greed Index stands at 64, classified as Greed. That describes a risk-appetite backdrop, but does not resolve CRV’s conflicting momentum signals
CoinGecko reports total cryptocurrency market capitalization at $2.83 trillion and Bitcoin dominance at 58.77%. These are current market levels, not evidence of a directional change in dominance or capital rotation into CRV. The asset-specific breakout case still rests on its own price structure
No. Daily RSI is 57.4, hourly RSI is 66.6 and 15-minute RSI is 60.0. None exceeds 70; the hourly reading is the closest to that threshold
Not on the supplied completed-candle data. The live price is above daily R1 at $0.3945, but the last completed daily candle closed at $0.3815
Disclaimer: This article is for informational purposes only and does not constitute financial advice, an investment recommendation, or a solicitation to buy or sell any financial instrument or cryptocurrency. The analysis provided is not indicative of future results. Investing in crypto assets and financial markets carries a high risk of capital loss. Always do your own research (DYOR) and consult a qualified financial advisor before making any decision
Article produced with the assistance of artificial intelligence and reviewed by the editorial team
Stay updated on all the news about cryptocurrencies and the entire world of blockchain