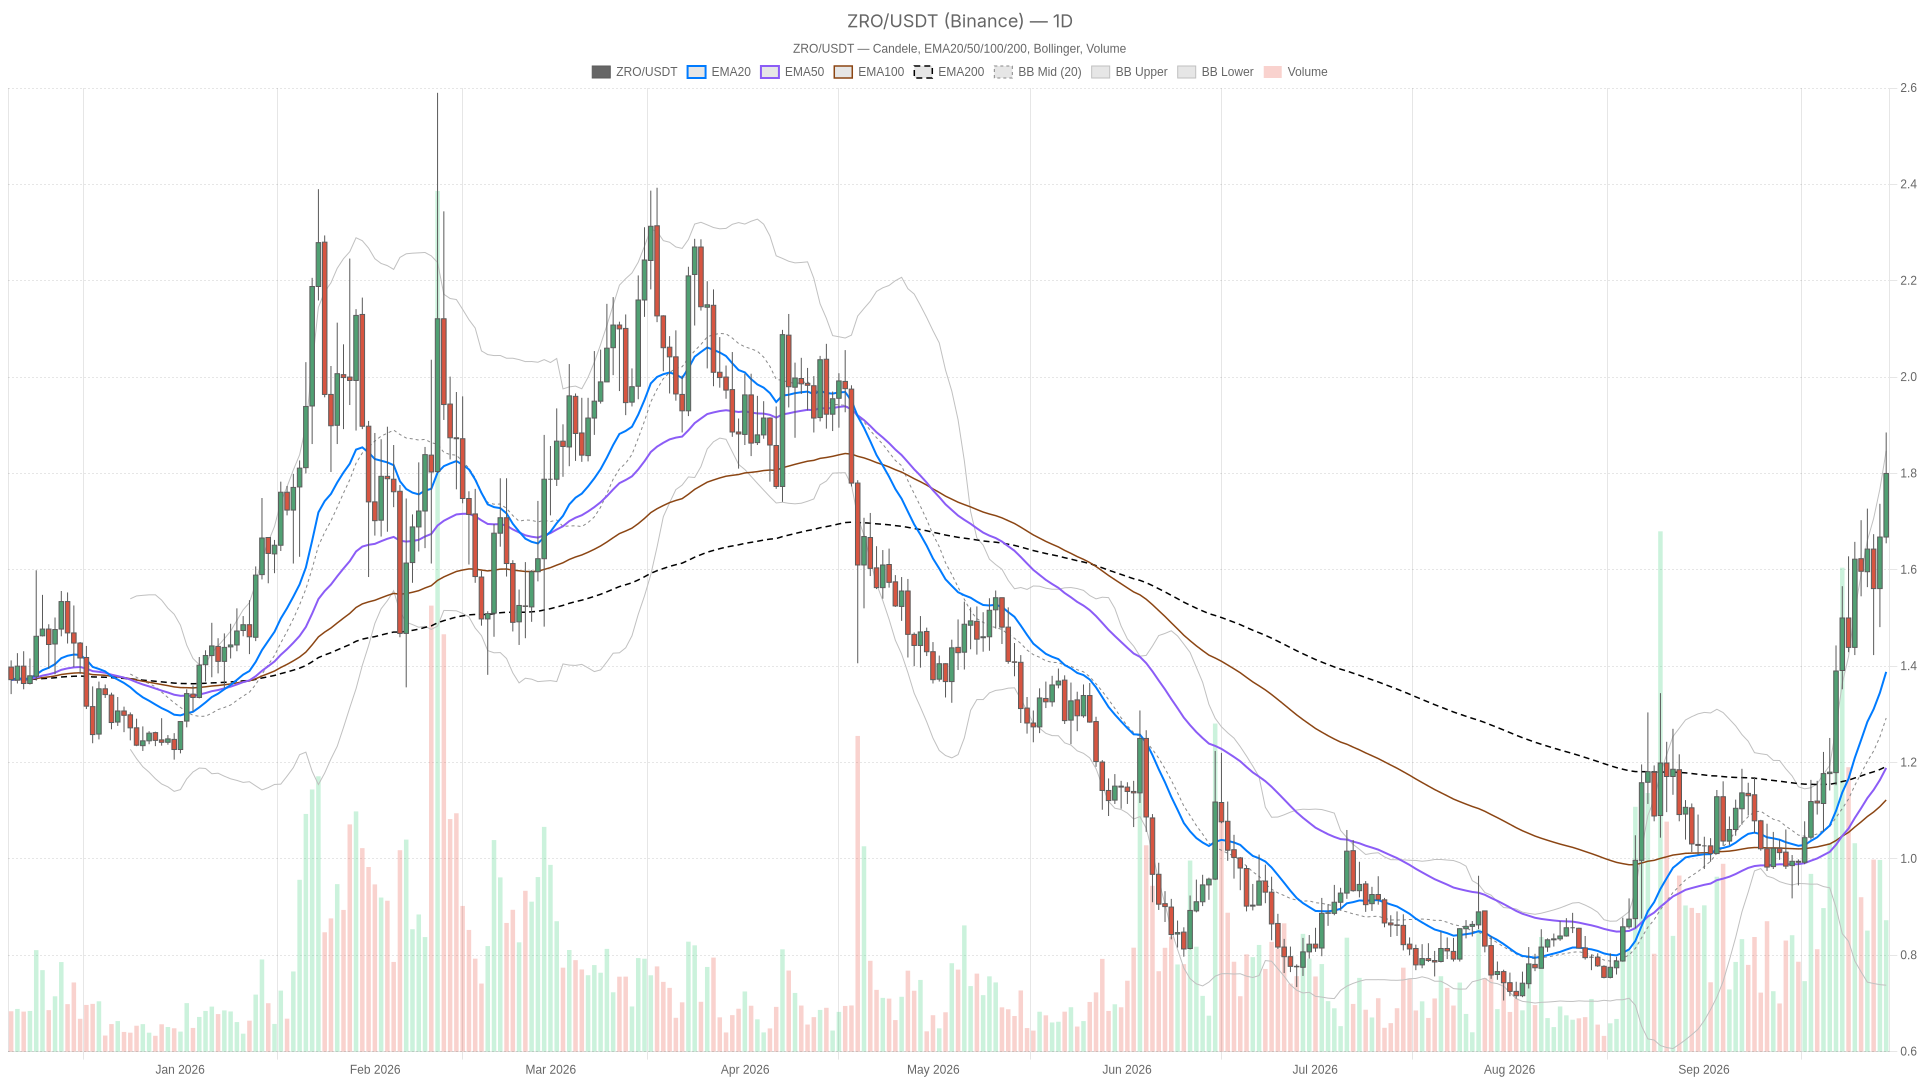
As of late September 2026, ZRO is trading near $1.80 while much of the crypto market retreats, a divergence that puts LayerZero crypto firmly in the spotlight. The token’s resilience against a 3.74% broader market drop raises questions about how much fuel the rally has left
ZRO’s daily chart confirms a strong uptrend with price well above all major exponential moving averages, though the RSI at 76.91 warns that conditions are stretched. On the daily chart, ZRO is trading at $1.80, sitting well above its EMA20 ($1.3882), EMA50 ($1.1888) and EMA200 ($1.1917). That’s a textbook bullish stack — short-term average above medium-term, both above long-term — and it tells you the uptrend in LayerZero crypto has been decisive rather than choppy. The catch is the RSI14 at 76.91, deep into overbought territory. That doesn’t automatically mean a reversal is coming, but it does mean fresh buyers are paying a premium, and any stall in volume could trigger a sharp cooling-off
The MACD backs the bullish read for now: the line is at 0.17666, above the signal at 0.12753, with a positive histogram of 0.04913. Momentum is still expanding, not fading. However, the system’s own regime classification on this timeframe reads “neutral,” a reminder that trend strength and trend maturity are two different things. Price is also pressing against the upper Bollinger Band ($1.8469), with the mid-band at $1.2924 and the lower band all the way down at $0.73779. That’s a wide band, and being glued to the top of it is typical of an asset in a strong impulsive move — but also one that’s vulnerable to a snapback if buyers pause
ATR14 stands at 0.18236, a meaningfully high volatility reading relative to the current price — expect swings, not a slow grind. Daily pivots frame the immediate battle lines: pivot point at $1.78, resistance at $1.905, support at $1.675. Price hovering just above pivot, right under R1, is exactly the kind of setup where a breakout above $1.905 could accelerate gains, while a rejection sends price back toward the pivot or the $1.675 support
The 1-hour chart aligns with the daily bullish bias, showing price above all EMAs and flagged outright as bullish, with RSI at 64.8 leaving some room before this timeframe becomes overbought. Price at $1.802 is above EMA20 ($1.7131), EMA50 ($1.6471) and EMA200 ($1.5151), and the system flags this timeframe outright as “bullish.” RSI14 at 64.8 is firm but not extreme — there’s still some room before this timeframe itself gets overbought. MACD is positive here too (line 0.064135 vs signal 0.049048, histogram 0.015087), so intraday momentum is aligned with the bigger picture
Bollinger Bands on the 1H (mid $1.6933, upper $1.8865, lower $1.5001) show price trading in the upper half of the range but not glued to the ceiling the way it is on the daily chart. That’s a sign the shorter-term trend has a bit more breathing room than the daily chart does. Moreover, ATR14 here is 0.0545, and the 1H pivots (pp $1.7977, r1 $1.8113, s1 $1.7883) are tightly packed, which tells you intraday price action has been compressing just above pivot — often a precursor to a decisive move once it resolves
This is where the picture gets more interesting — and more cautious. On the 15-minute chart, price at $1.803 is basically sitting on its EMA20 ($1.8069), still above EMA50 ($1.7472) and EMA200 ($1.6432), so the short-term structure hasn’t broken down. But RSI14 has cooled to 53.21 — dead neutral — and the MACD has flipped: line at 0.023431 is now below signal at 0.035251, with a negative histogram of -0.01182. That’s a short-term bearish cross inside a broader bullish structure, exactly the kind of tension that separates a healthy pullback from the start of something worse
The 15m Bollinger mid at $1.8198 sits just above current price, with bands between $1.7521 and $1.8876 — a tight range relative to the daily chart, consistent with consolidation rather than a fresh leg. Pivots here (pp $1.7987, r1 $1.8073, s1 $1.7943) are useful only for execution: a hold above $1.7943 keeps the intraday bias intact, while a break below opens the door to a retest of the 1H EMA20 near $1.71
The bullish case hinges on a clean break above $1.905, which would likely draw in momentum buyers and open a path toward the upper Bollinger Band extension. The daily and 1H alignment supports this: price above every major EMA on both timeframes, MACD positive on both, and a Fear & Greed reading that still favors risk-taking. For this to play out, the 15m MACD needs to flip back positive and RSI needs to reclaim ground above 60 — confirmation that the pause is being bought, not sold
What would invalidate this: a daily close back below the pivot at $1.78, or worse, a slide through $1.675 support, would undercut the bullish structure and likely trigger a deeper correction given how stretched the RSI already is
The bearish case starts with the unsustainable daily RSI near 77, compounded by the 15-minute MACD already rolling over. An RSI near 77 on the daily chart is not sustainable indefinitely. If the broader market’s 24-hour drawdown of nearly 3.74% starts pulling altcoins down with it, ZRO’s outperformance could reverse quickly — overbought assets tend to correct hardest when sentiment shifts. A break below the 15m EMA20 ($1.8069) followed by a loss of the 1H EMA50 ($1.6471) would be the clearest signal that the pullback has legs
What would invalidate this: renewed MACD expansion on the 1H and 15m timeframes together with RSI holding above 55 on the hourly chart would suggest buyers have absorbed the profit-taking and the uptrend is simply resetting rather than reversing
Right now, ZRO’s trend is working but running hot — daily momentum is real, 1H structure confirms it, and the 15-minute chart is flashing early signs of hesitation. That’s not a contradiction; it’s just what late-stage impulsive moves usually look like before they either break out or take a breather. According to CoinGecko figures, the wider market is down close to 3.74% over 24 hours while ZRO holds its ground, which is either a sign of genuine relative strength or a token that hasn’t yet caught up with the broader risk-off mood — both are plausible until price actually moves
Given the ATR readings across all three timeframes, volatility here is elevated, and levels like the daily pivot ($1.78) and R1 ($1.905) are the ones worth watching rather than guessing at a direction. The overbought daily RSI should be treated as a flag for reduced position sizing and tighter risk control, not as a prediction of an immediate reversal — momentum can stay stretched longer than seems reasonable, right up until it doesn’t
ZRO’s resilience while the total crypto market cap fell 3.74% to $2.86 trillion likely reflects genuine demand for LayerZero’s cross-chain infrastructure rather than broad market momentum. With Bitcoin dominance at 58.3% and a Fear & Greed Index of 71, traders appear to be rotating into select altcoins with strong fundamentals rather than exiting entirely
Not necessarily. While the RSI14 at 76.91 signals overbought conditions, the MACD remains positive and expanding on both daily and 1H timeframes. Overbought readings in strong trends can persist longer than expected. The key is watching for confirmation of a reversal — such as a daily close below $1.78 or MACD turning negative — rather than preempting one
The daily pivot at $1.78 serves as the near-term line in the sand for bullish structure, while resistance at $1.905 marks the breakout level that could trigger acceleration. On the downside, support at $1.675 and the 1H EMA50 at $1.6471 are the levels where a pullback would start looking more serious than a routine cooldown
Disclaimer: This article is for informational purposes only and does not constitute financial advice, an investment recommendation, or a solicitation to buy or sell any financial instrument or cryptocurrency. The analysis provided is not indicative of future results. Investing in crypto assets and financial markets carries a high risk of capital loss. Always do your own research (DYOR) and consult a qualified financial advisor before making any decision
Article produced with the assistance of artificial intelligence and reviewed by the editorial team
Stay updated on all the news about cryptocurrencies and the entire world of blockchain